The iMGP RBA Responsible Global Allocation ETF outperformed its benchmark in the second quarter 2022, posting a return of -10.21% at NAV and -10.68 at market price compared to a -11.90% return for its benchmark index (65% MSCI ACWI, 35% Bloomberg US Aggregate Bond Index).
Performance data quoted represents past performance. Past performance does not guarantee future results. The investment return and principal value of an investment will fluctuate so that an investor’s shares, when redeemed, may be worth more or less than their original cost. Current performance of the fund may be lower or higher than the performance quoted. Short term performance is not a good indication of the fund’s future performance and should not be the sole basis for investing in the fund. Performance data current to the most recent month end may be obtained by visiting www.imgpfunds.com. The Advisor has contractually agreed to limit the expenses for at least one year from the effective date of the Trust’s registration statement.
Equity Positioning and Performance Attribution
The portfolio was slightly overweight equity over the period, holding an average weight of 67.3% (2.3percentage point “ppt.” overweight) in 2Q22. The equity sleeve outperformed by 1.7% vs. the MSCI ACWI Index. This outperformance was driven by the underweights to long duration growth names in the tech, consumer discretionary, and communication services sectors as well as overweights to more defensive sectors such as consumer staples and health care. Overweighting Japan and Europe relative to ACWI was also accretive to the portfolio. Our underweightto the energy sector and overweight to the materials sector detracted slightly from performance for the quarter.
Fixed Income Positioning and Performance Attribution
The portfolio was underweight fixed income over the period, holding an average weight of 32.5% (2.5ppt underweight) in 2Q22. The fixed income sleeve outperformed slightly by 0.05%. Overweighting investment grade and high yield corporates were the strongest themes for the quarter in the fixed income sleeve. Underweighting treasuries during the quarter detracted from performance. Our shorter duration corporate theme helped performance through the quarter.
Outlook and Positioning
RBA’s investment process remains focused on its three pillars of corporate profit cycles, liquidity, and investor sentiment/valuation, all of which suggest that we remain in a weakening fundamental backdrop. Corporate profit growth continues to decelerate and the Fed appears increasingly committed to tightening liquidity to rein in inflation. While deteriorating investor sentiment is reflected in lower valuations, significant portions of the market remain relatively expensive and US household equity allocations remain near all-time highs.
Despite today’s environment of heightened uncertainty surrounding the Russia/Ukraine conflict, tensions with China, Fed policy and fears of a recession, there is a high degree of certainty around two key market drivers. Regardless of the geopolitical backdrop, it seems very likely that (1) profits will continue to decelerate, and (2) the Fed will continue to tighten monetary policy.
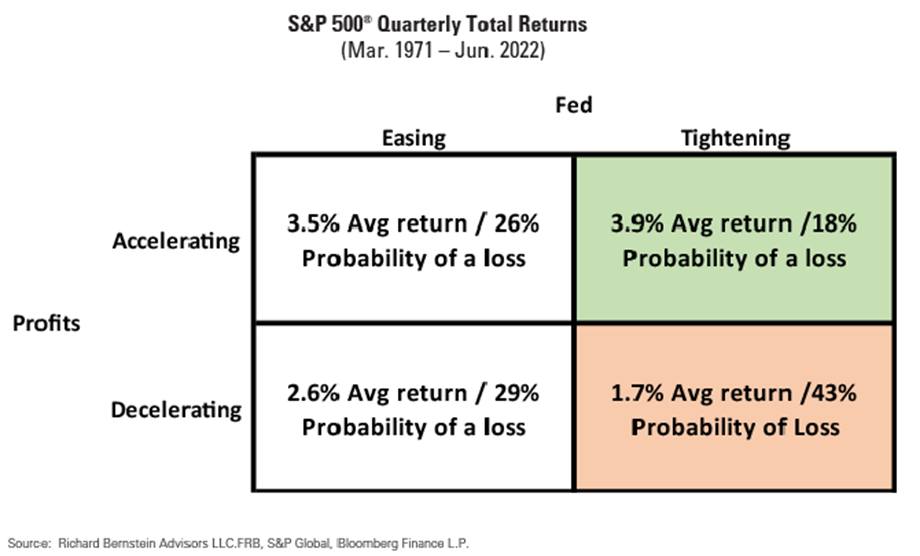
Historically, there has been a reasonably high correlation between the Fed Funds rate and the profits cycle, i.e., interest rates rose as profits accelerated and fell as profits decelerated. That historical relationship implied monetary policy was a good ballast to economic and profits growth. There have been only a few periods when the Fed raised rates despite a decelerating profits cycle (e.g., 1989 and 2005). However, if our forecast for profits growth is on the correct (downward) path and the Fed continues to hike interest rates, investors might be faced with this relatively rare combination again. The matrix below shows the average S&P 500® quarterly return during the various combinations of Fed policy and profits growth. One can see that Fed tightening with decelerating profits has been the worst environment for S&P 500 quarterly returns on average (the orange quadrant).
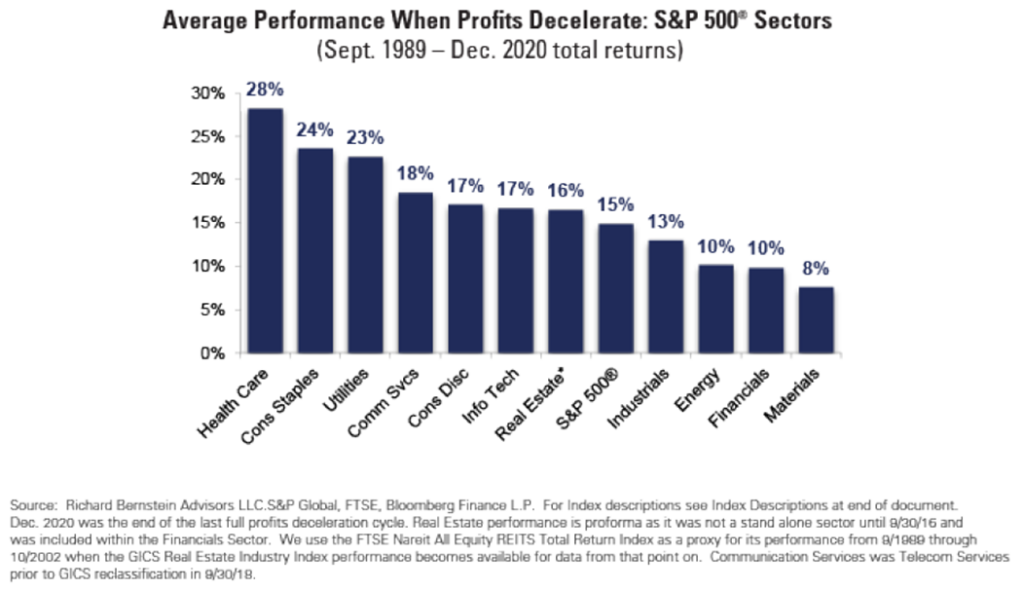
The following chart shows sector performance during periods when the profits cycle has historically decelerated. As one might expect, defensive sectors tend to outperform. That’s especially interesting because the current discussion among most investors seems to center on whether one should accentuate cyclicals or growth stocks, with little mention of traditional defensive sectors.
Consistent with this, and based on RBA’s proprietary indicators and analysis, RBA has been reducing overall portfolio risk and cyclicality (equity beta) while increasing exposure to higher quality and less economically sensitive investments.
IRBA Portfolio Allocations as of June 30, 2022
| Asset Class Exposures (%) | |
| US Equities | 38.4% |
| Non-U.S. Equities | 27.4% |
| U.S. Fixed Income | 25.5% |
| Non-U.S. Fixed Income | 7.9% |
| Cash | 0.8% |
| IRBA vs. Blended 65/35 Benchmark | IRBA Weight | Benchmark Weight | Relative Weight |
| JPY/USD | 65.8% | 65.0% | 0.8% |
| Crude Oil | 33.5% | 35.0% | -1.5% |
| 2 Yr Treasury | 0.8% | 0.0% | 0.8% |
| Eurodollar | 100% | 100% | 0.0% |
| IRBA Equity Region vs MSCI ACWI Net Index | IRBA Weight | Benchmark Weight | Relative Weight |
| US | 58.4% | 61.7% | -3.4% |
| Canada | 1.7% | 3.1% | -1.5% |
| Europe | 15.4% | 11.0% | 4.5% |
| United Kingdom | 4.3% | 3.3% | 1.0% |
| Japan | 8.8% | 5.5% | 3.4% |
| Asia ex-Japan | 4.7% | 3.3% | 1.4% |
| Emerging Markets | 6.8% | 12.2% | -5.4% |
| Total | 100% | 100% | 0.0% |
| IRBA Equity Sector vs MSCI ACWI Net Index | IRBA Weight | Benchmark Weight | Relative Weight |
| Communication Services | 5.0% | 7.9% | -2.9% |
| Consumer Discretionary | 7.3% | 11.1% | -3.8% |
| Consumer Staples | 12.5% | 7.6% | 4.9% |
| Energy | 2.1% | 5.0% | -2.8% |
| Financials | 13.2% | 14.5% | -1.3% |
| Health Care | 16.3% | 13.0% | 3.3% |
| Industrials | 13.0% | 9.4% | 3.6% |
| Information Technology | 12.5% | 20.9% | -8.3% |
| Materials | 7.1% | 4.8% | 2.3% |
| Real Estate | 7.5% | 2.8% | 4.7% |
| Utilities | 3.6% | 3.2% | 0.4% |
| Total | 100.0% | 100.00% | 0.00% |