The iMGP RBA Responsible Global Allocation ETF underperformed its benchmark in 3Q22, posting a return of -6.53% compared to a -6.03% return for its style index (65% MSCI ACWI, 35% Bloomberg US Agg).
Performance data quoted represents past performance. Past performance does not guarantee future results. The investment return and principal value of an investment will fluctuate so that an investor’s shares, when redeemed, may be worth more or less than their original cost. Current performance of the fund may be lower or higher than the performance quoted. Short term performance is not a good indication of the fund’s future performance and should not be the sole basis for investing in the fund. Performance data current to the most recent month end may be obtained by visiting www.imgpfunds.com.
Equity Positioning and Performance Attribution
The Strategy was underweight equity over the period, holding an average weight of 63.2% (1.8 ppt underweight) in 3Q22. The equity sleeve underperformed by 1.9% vs. the MSCI ACWI Index. This underperformance was driven by the underweight to the consumer discretionary sector as well as over weights to more defensive sectors such as consumer staples and real estate. Overweighting energy was also detractive. Overweighting Japan and underweighting EM as a whole was accretive to performance within the equity sleeve.
Fixed Income Positioning and Performance Attribution
The Strategy was underweight fixed income over the period, holding an average weight of 33.7% (1.3 ppt underweight) in 3Q22. The fixed income sleeve underperformed slightly by .1%. Overweighting treasuries and underweighting mortgages helped slightly for the quarter in the fixed income sleeve. Investment grade corporate selection hurt performance slightly.
Outlook and Positioning
RBA’s investment process remains focused on corporate profits, liquidity and investor sentiment, all of which suggest that we remain in a weakening fundamental backdrop. We expect the US to enter a full-blown profits recession — i.e., negative corporate profits growth — by early next year, as corporations face the troublesome combination of weakening demand, rising labor costs, a very strong dollar, and the simple math of difficult comparisons with 2021-22’s strong earnings growth. The combination of the Fed tightening monetary policy and profits decelerating means both primary inputs to valuation are worsening.
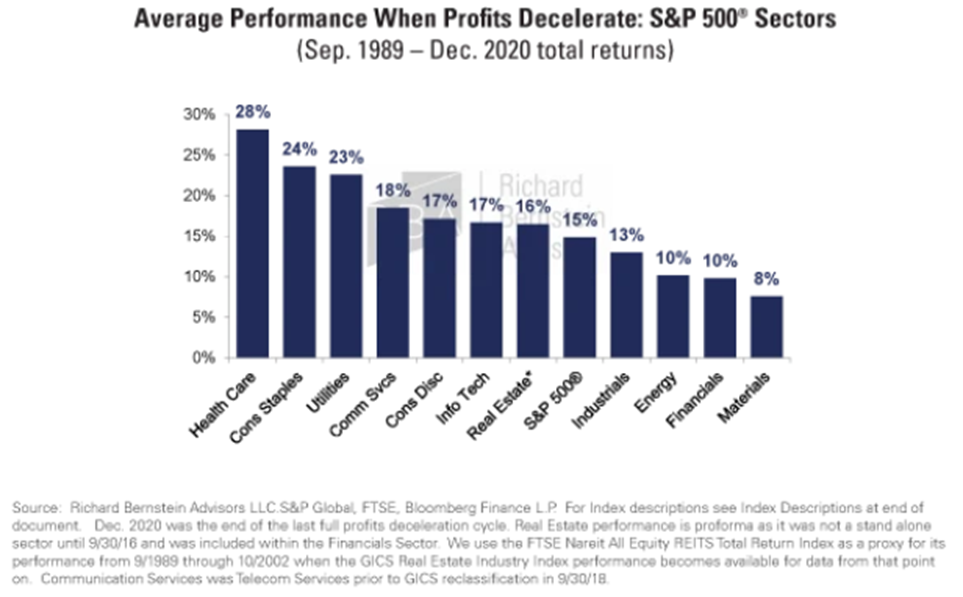
A popular debate centers on the relative attractiveness of cyclicals versus growth — stocks more exposed to the economy compared with companies that have superior secular profits growth. Unfortunately, history suggests neither of those two groups lead performance when profits decelerate. Rather, defensive sectors tend to lead equity markets during profits recessions.
Relative earnings growth is a primary driver of stock returns. Earnings growth in defensive stocks that are less economically sensitive tend to look very boring and too stable when the economy is booming, but they become quite attractive during profits recessions when broad earnings growth turns negative. Consumer staples, healthcare, and utilities have historically been the three best performing sectors during such periods. One needs to remember that no matter what goes on in the economy, people still eat. They might switch from steak to bologna, however, so necessities rather than dreams and desires usually dominate successful investment themes during profits recessions.
It also seems unrealistic to assume that lower quality credits will go untouched by tighter monetary conditions. After all, isn’t that the whole point to tightening? Indeed, credit spreads have already begun to widen as the Fed has raised rates, and we expect a profits recession in 2023 to cause credit spreads to widen further.
There comes a point in every cycle during which investors believe the markets will “look beyond the recession.” This provides comfort to those holding more cyclical assets, but the markets have never ignored a profits or economic recession. Investors should resist the knee-jerk reaction of rushing to speculative assets based solely on the Fed potentially reversing course. We believe that portfolios also need to reflect the realities of an approaching profits recession.
IRBA Portfolio Allocations as of September 30, 2022
| Asset Class Exposures (%) | |
| US Equities | 31.3% |
| Non-U.S. Equities | 26.4% |
| U.S. Fixed Income | 30.7% |
| Non-U.S. Fixed Income | 4.0% |
| Cash | 7.7% |
| IRBA vs. Blended 65/35 Benchmark | IRBA Weight | Benchmark Weight | Relative Weight |
| Equity | 57.7% | 65.0% | -7.4% |
| Fixed Income | 34.7% | 35.0% | -0.3% |
| Cash | 7.7% | 0.0% | 7.7% |
| Total | 100% | 100% | 0.0% |
| IRBA Equity Region vs MSCI ACWI Net Index | IRBA Weight | Benchmark Weight | Relative Weight |
| US | 54.3% | 63.01% | -8.7% |
| Canada | 1.8% | 3.1% | -1.2% |
| Europe | 17.2% | 10.6% | 6.6% |
| United Kingdom | 4.4% | 3.1% | 1.3% |
| Japan | 10.5% | 5.4% | 5.1% |
| Asia ex-Japan | 5.2% | 3.2% | 1.9% |
| Emerging Markets | 6.7% | 11.6% | -5.0% |
| Total | 100% | 100% | 0.0% |
| IRBA Equity Sector vs MSCI ACWI Net Index | IRBA Weight | Benchmark Weight | Relative Weight |
| Communication Services | 4.4% | 7.3% | -2.9% |
| Consumer Discretionary | 7.0% | 11.6% | -4.6% |
| Consumer Staples | 12.7% | 7.7% | 5.1% |
| Energy | 2.4% | 5.2% | -2.9% |
| Financials | 12.8% | 14.5% | -1.7% |
| Health Care | 17.1% | 12.9% | 4.2% |
| Industrials | 13.2% | 9.5% | 3.7% |
| Information Technology | 11.8% | 20.8% | -8.9% |
| Materials | 7.3% | 4.7% | 2.6% |
| Real Estate | 7.4% | 2.7% | 4.8% |
| Utilities | 3.8% | 3.1% | 0.7% |
| Total | 100.0% | 100.00% | 0.00% |