This is the first full quarter for the iMGP Oldfield International Value Fund. We are pleased to report the fund returned 10.85% during the first quarter of 2021, beating benchmarks MSCI EAFE Value NR (+7.44%) and MSCI EAFE NR (+3.48%). The fund was also ahead of the Morningstar Foreign Large Value Category peer group, which was up 7.14%.
Performance quoted represents past performance and does not guarantee future results. The investment return and principal value of an investment will fluctuate so that an investor’s shares, when redeemed, may be worth more or less than their original cost. Current performance of the funds may be lower or higher than the performance quoted. To obtain standardized performance of the funds, and performance as of the most recently completed calendar month, please visit www.imgpfunds.com.
Introduction to Oldfield Partners
We have known Oldfield Partners since 2015 and initiated deep due diligence in the second half of 2019 before launching the fund November 30, 2020. Since inception, the fund has returned 17.50%, which compares to the MSCI EAFE Value index and peer group returns of 12.20% and 12.68%, respectively.
Oldfield Partners is a London-based privately-owned boutique investment firm focused on one investment style—value. A classic contrarian global value manager, they will go where they see bargains, so they bring a broad perspective and their EAFE portfolio gives broad sector and geographical exposure, which includes emerging markets on an opportunistic basis. The firm brings together a highly experienced team of generalist investors who have collaborated over a long period successfully. The culture at Oldfield Partners can be described as patient, supportive and respectful of each other, focused on investing, and one that promotes rigorous debates and ongoing learning. We believe Oldfield Partners has exceptional investment discipline, which makes them particularly well-suited to take advantage of opportunities in the international-value space on offer today.
After over a decade of value underperformance, we see signs we may be entering an environment in favor of value similar to what we saw post the Technology and Telecom bubble in 2000s. We think the odds are high the coordinated global efforts to reflate economies since the pandemic could help normalize interest rates up from current very low levels and make “growth” less scarce—two main factors that we think have been behind the value style’s historic underperformance.
Growth Stocks Have Dominated Value Stocks for 13 Years
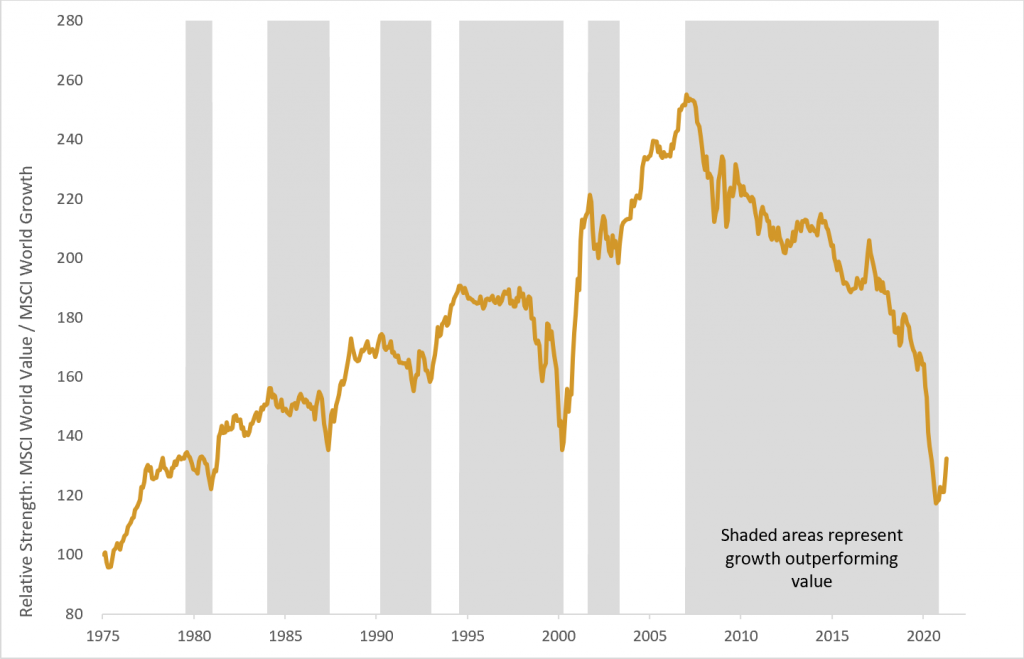
You cannot invest directly in an index.
Past Performance is no guarantee of future results.
We are optimistic about the fund’s long-term prospects and are investors in the fund.
Commentary from Oldfield Partners
Over the last six months, there has been a clear rotation to value. As classic, contrarian value investors, this style rotation has been very supportive of our approach. This rotation is coming off a historically wide dispersion (in relative valuation and performance terms) between the growth and value styles. We believe that the opportunity in value investing remains as great as perhaps at any time in our careers. In our unwavering hunt for value opportunities, we continue to focus on essentially sound companies trading at valuations that are low relative to the market and low relative to the growth and returns we think the companies are capable of. There remains all manner of speculative behavior in the financial markets today that relies on the underpinning from the largesse of the world’s central banks. We think this is reckless and the blow up at Archegos Capital is perhaps a “canary in the coal mine.”
Discussion of Performance Drivers
Portfolio managers Nigel Waller and Andrew Goodwin build the iMGP Oldfield International Value portfolio stock by stock, focusing on only their highest-conviction ideas and ensuring proper diversification across regions, sectors, and other investment drivers that companies in their portfolio may have in common. As such, sector and country allocations are largely a byproduct of their stock picking.
| Sector Weights | Fund | iShares MSCI EAFE Value ETF as of 3/31/2021 |
|---|---|---|
| Communication Services | 6.0% | 7.0% |
| Consumer Discretionary | 8.7% | 9.2% |
| Consumer Staples | 3.1% | 8.4% |
| Energy | 3.8% | 5.4% |
| Finance | 21.8% | 26.3% |
| Health Care & Pharmaceuticals | 9.6% | 6.8% |
| Industrials | 21.6% | 13.1% |
| Information Technology | 5.7% | 2.5% |
| Materials | 0.0% | 9.4% |
| Real Estate | 0.0% | 4.7% |
| Utilities | 10.3% | 6.3% |
| Cash | 9.3% | 0.9% |
| 100.00% | 100.00% |
Our attribution analysis shows:
- Stock selection was the primary driver behind the fund’s outperformance during the quarter.
- From a regional perspective, an overweight to emerging markets was a slight positive. Two stocks drove this positive contribution—Embraer (Brazil) and Samsung Electronics (Korea). The third EM stock, Korea Electric Power, discussed below, was a detractor from performance during this period.
- Sector allocation effect overall was a slight negative. An overweight to utilities and an underweight to financials detracted from relative performance.
- Stock selection was particularly strong in industrials, the sector in which the fund has the largest overweighting (20.33% vs 13.05% for MSCI EAFE Value index). Embraer and Siemens AG were the top two performers in this sector.
- Stock selection was slightly positive in financials, where the fund is underweight (16.59% vs 25.84%). Mitsubishi UFJ and Lloyds Bank were top performers in this sector. Another sector where stock selection added value was communication services, driven by BT Group, the fund’s only holding in this sector.
- Stock selection within the consumer discretionary sector detracted from relative performance slightly as Toyota (up about 5%) lagged on a relative basis.
Top 10 Contributors as of the Quarter Ended March 31, 2021
| Company Name | Fund Weight (%) | Benchmark Weight (%) | 3-Month Return (%) | Contribution to Return (%) | Economic Sector |
|---|---|---|---|---|---|
| Embraer SA ADR | 3.82 | 0.00 | 46.99 | 1.68 | Industrials |
| Mitsubishi UFJ Financial Group Inc | 5.06 | 0.74 | 23.67 | 1.12 | Financials |
| EASYJET PLC | 3.86 | 0.00 | 19.57 | 0.97 | Industrials |
| BT Group PLC | 5.16 | 0.20 | 18.14 | 0.98 | Communication |
| Eni SpA | 4.03 | 0.34 | 17.92 | 0.72 | Energy |
| Lloyds Banking Group | 5.59 | 0.44 | 17.81 | 0.98 | Financials |
| Kansai Electrical Power Co Inc | 3.19 | 0.09 | 17.36 | 0.52 | Utilities |
| Siemens AG | 7.03 | 1.43 | 16.60 | 1.12 | Industrials |
| Bayer AG | 5.61 | 0.74 | 7.64 | 0.42 | Health Care |
| E.ON SE | 4.84 | 0.29 | 5.17 | 0.32 | Utilities |
Edited Oldfield Commentary on Selected Contributors
Embraer – Embraer is geared to the recovery in regional jet and executive aircraft demand that suffered a sharp downturn at the onset of the pandemic. In the quarter they reported results for the fourth quarter of 2020 which highlighted higher than anticipated deliveries, a relatively stable order book, and strong free cash flow generation underpinning the recovery in the fundamentals. It has a leading position in the consolidated regional jet sector and a quality engineering team having brought 26 aircraft through certification and to market in the last 20 years—on time and on budget. The current market capitalization of $2 billion remains at a significant discount to the price implied by the bid from Boeing for just its commercial aircraft division and the current valuation remains at around a 20% discount to book value.
MUFG – The steepening of the yield curve is improving the outlook for the global banking sector. Mitsubishi UFJ has come through 2020 with a relatively small requirement for higher credit provisions, highlighting the strength of its loan book and its resilient balance sheet. It continues to trade at a depressed valuation level of less than half its equity book value with “hidden assets” in its stakes in Morgan Stanley and domestic listed equities.
Siemens – Siemens pre-released positive results during the quarter. Its Digital Industries and Smart Infrastructure divisions were particularly strong, driven by higher capacity utilization and the continued strength of the software business. Siemens has been going through a process of simplification, having spun off several businesses in recent years. The resulting business is well positioned in several key growth areas especially linked to factory automation. The refocussing of Siemens continues to create real value for its shareholders. As the group has refocussed, its underlying profit margins and returns on capital have increased while its sustainable growth rate has also risen, together justifying a higher fair value.
Top 10 Detractors as of the Quarter Ending March 31, 2021
| Company Name | Fund Weight (%) | Benchmark Weight (%) | 3-Month Return (%) | Contribution to Return (%) | Economic Sector |
|---|---|---|---|---|---|
| Korea Electric Power Corp ADR | 3.43 | 0.00 | -16.38 | -0.71 | Utilities |
| Sanofi India Ltd | 4.84 | 0.00 | -5.37 | -0.23 | Health Care |
| Tesco PLC | 4.41 | 0.32 | -4.77 | -0.20 | Consumer Staples |
| SIEMENS ENERGY AG | 0.36 | 0.00 | -4.56 | -0.06 | Industrials |
| Fresenius SE & Co KGaA | 0.01 | 0.22 | 0.10 | 0.00 | Health Care |
| Toyota Motor Corp | 4.52 | 1.91 | 1.17 | 0.03 | Consumer Discretionary |
| Svenska Handelsbanken A | 1.04 | 0.20 | 2.19 | 0.08 | Financials |
| Svenska Handelsbanken A SHS | 0.11 | 0.00 | 3.50 | 0.12 | Financials |
| Mitsubishi Heavy Industries Ltd | 4.35 | 0.12 | 4.28 | 0.16 | Industrials |
| East Japan Railway Co | 3.69 | 0.25 | 7.04 | 0.21 | Industrials |
Edited Oldfield Commentary on Selected Detractors
Kepco – Korea Electric Power’s (Kepco) share price reacted positively, given the proposed changes to its tariff system, which meant that it would move to a fuel cost pass through system. Importantly, this also includes carbon pricing, which is a real positive in a world pushing for zero carbon. However, investors are rightly cautious on regulatory change around this monopolistic provider of energy in Korea, which has been used to bolster the popularity of politicians at the expense of shareholders (which includes the Korean government) in the past. In recent years, returns have collapsed as necessary tariff hikes were continually delayed, which meant the valuation fell from an already low 0.5x price to book value to just 0.2x. Clearly this de-rating reflects the fall in returns and the increased regulatory uncertainty. The move to a fuel cost pass through system should lead to greater clarity and higher returns over time, but in practice this meant tariffs fell in the first quarter of 2021 to reflect short-term declines in input costs. The new regulatory system should make Kepco a much more appealing investment given greater visibility on potentially higher returns and drive a re-rating.
Sanofi – Sanofi has so far failed to deliver on its pursuit of a vaccine for COVID 19, in partnership with GlaxoSmithkline (GSK). In 2019, GSK, Sanofi, Merck, and Pfizer dominated the vaccine market with best-selling vaccines for flu, pneumonia, HPV, and shingles. Among the top vaccine makers, only Pfizer has had success for COVID-19, developed with the German company BioNTech. The Sanofi/GSK vaccine has been delayed by about six months after trial participants were mistakenly given a less concentrated dose, resulting in a weaker immune response. Whilst this is disappointing, this does not materially impact the enduring earnings power of this diverse pharmaceutical business, which is trading at a large discount to its peers on just 12x forward price-to-earnings multiple.
Tesco – Tesco paid a £5 billion special dividend to shareholders in the quarter following the disposal of its Asian operations. The rest of the proceeds from the sale were used to eliminate the pension deficit and reduce debt. The COVID pandemic has brought both opportunities and challenges for Tesco. People have turned to large supermarkets, bigger basket sizes, and more online food shopping—areas that play to Tesco’s strengths. However, Tesco has incurred incremental costs to cater for this, needing to hire more people while also covering COVID-related staff absenteeism. Many of these issues should improve over the coming quarters. Tesco is trading on a forward price-to-earnings multiple of 11x, allowing for this “normal” environment. Cash generation has been strong, and much could be returned to shareholders through dividends.